Candlestick for dummies, 90% Accuracy. What i know little bit about how to predict stock price
It never guarantees that all these candlestick patterns can work all the time, because predicting stock market using technical analysis is not enough, there’s also one important factor, a fundamental of the company, that plays a significant role of its stock prices.
But below candlestick is what I call common sense, after years of years reading the candlestick chart, these are what comes to my conclusion of whether the price will go up or down.
There’s human psychology involved in determining stock prices so by reading candlestick, i believe know about 90% accuracy where the price will move (but again not always).
GREEN CANDLE BIGGER THEN 3-4 PREVIOUS READ (SUPPORT)

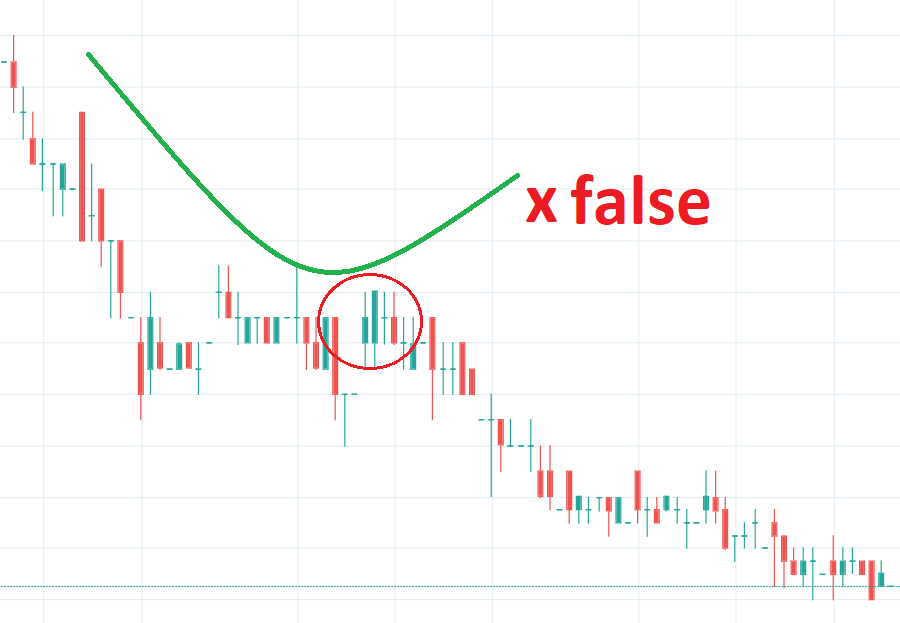
NOT BIG ENOUGH GREEN CANDLE (RESISTANT)

NOT HAVE BIG GREEN BODY, BUT THE STICK IS LONGER THAN PREV POSITION

DEFINITELY SUPPORT

HAMMER

CONSOLIDATION (HOLD UNTIL FURTHER INDICATOR FOR SUPPORT OR RESISTANT)

Sometimes none of those things works, but most of the time it can work, because stock prices not determined by candlestick, it’s not math, there’s no formula to calculate the future prices of stock, hundred percent by supply and demand.
The easiest way of predicting the market is by the volume of one stock being traded (the bigger the candle, the bigger the volatility means the bigger volume). Either traders want to buy the shares or want to sell eagerly. The basic principal is usually three green candle will continue up, three red candle will continue sell down.
But below candlestick is what I call common sense, after years of years reading the candlestick chart, these are what comes to my conclusion of whether the price will go up or down.
There’s human psychology involved in determining stock prices so by reading candlestick, i believe know about 90% accuracy where the price will move (but again not always).
GREEN CANDLE BIGGER THEN 3-4 PREVIOUS READ (SUPPORT)

NOT BIG ENOUGH GREEN CANDLE (RESISTANT)
NOT HAVE BIG GREEN BODY, BUT THE STICK IS LONGER THAN PREV POSITION

DEFINITELY SUPPORT

HAMMER

CONSOLIDATION (HOLD UNTIL FURTHER INDICATOR FOR SUPPORT OR RESISTANT)

Sometimes none of those things works, but most of the time it can work, because stock prices not determined by candlestick, it’s not math, there’s no formula to calculate the future prices of stock, hundred percent by supply and demand.
The easiest way of predicting the market is by the volume of one stock being traded (the bigger the candle, the bigger the volatility means the bigger volume). Either traders want to buy the shares or want to sell eagerly. The basic principal is usually three green candle will continue up, three red candle will continue sell down.